Salesforce: Can the SaaS Pioneer Sprout New Growth?
 01/20 2025
 478
478
*Note: This text contains hidden valuation information not fully displayed here. Interested users can search for "Dolphin Investment Research" on the LongBridge App to read the full article with the same name for free.
Our previous research on Salesforce focused on Agentforce, a topic of recent market interest. We discussed its developmental limitations and potential impact on performance. While Agentforce holds vast prospects and market potential, its certainty and visibility are relatively low due to its recent launch. It is more of a "belief or disbelief" vision, akin to a performance call option. Pricing Agentforce is thus analogous to pricing an option, involving a limited premium for a low-certainty but high-elasticity return.
Ultimately, the fundamental valuation of Salesforce, regardless of Agentforce stories and recent gains, hinges on its existing business. The elasticity for subsequent price increases may primarily depend on Agentforce. Therefore, this article revisits Salesforce's core business to discuss its true value.
Here is the main content:
I. What Kind of Company is Salesforce?
1. Salesforce's Business and Revenue Composition
As the foundation for our analysis, it's essential to briefly introduce Salesforce's business and revenue composition. Salesforce, established in 1999, is the highest-revenue (approximately $38 billion in fiscal year 2025) and highest-market-cap (currently over $300 billion) native cloud-based enterprise service SaaS leader. Over 90% of its total revenue comes from subscription income for various SaaS cloud services.
The remaining revenue, a high single-digit percentage, comes from consulting and training services (Professional Service) provided to users adopting the products. However, this consulting business has historically barely broken even or operated at a negative gross margin, indicating that Salesforce does not consider it a primary revenue source but rather an ancillary "customer service." Salesforce's revenue and profit are nearly 100% derived from subscription income for its SaaS cloud services, which will be our focus later.
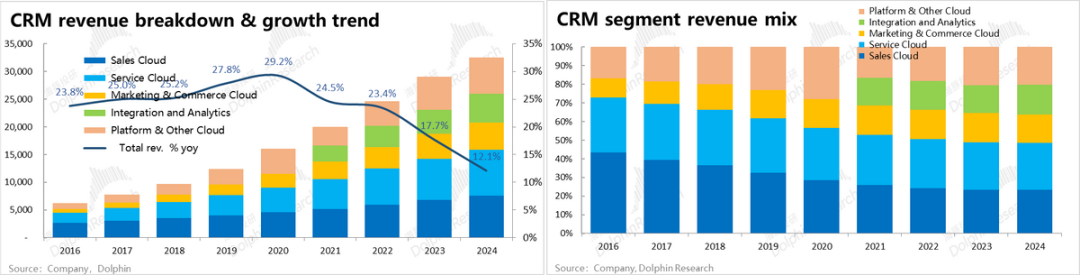
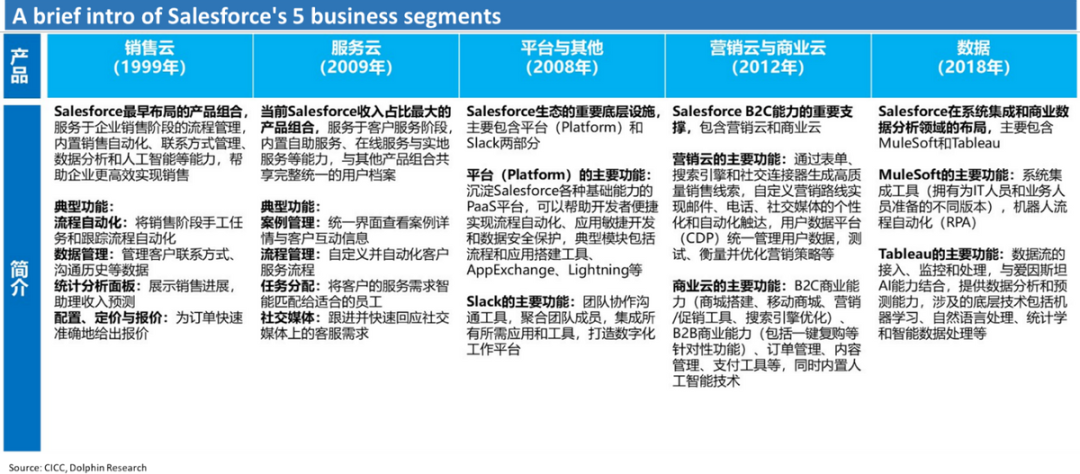
Salesforce's SaaS services are divided into five major segments: Sales Cloud, Service Cloud, Platform Cloud, Marketing & Commerce Cloud, and Data & Analytics. For a detailed breakdown of each segment's products or services, please refer to the table below. It can be observed that:
① While Salesforce initially focused on CRM software with Sales Cloud and Service Cloud contributing about 70% of total revenue in 2016, by fiscal year 2024, the revenue contributions of its five service segments were relatively balanced. Except for Data & Analytics, which was independently established in 2021 and contributed the lowest at approximately 16%, the other four segments contributed between 20% and 25% each. Salesforce is no longer solely focused on CRM but rather a diversified SaaS service provider with balanced business segments.
② In terms of growth rates, Sales Cloud has consistently grown at only 10%+ since 2016, losing its growth potential years ago. In contrast, Service Cloud, another legacy business (launched in 2009), maintained relatively high growth of 20% to 30% until 2022 and has since become Salesforce's largest revenue segment.
③ Including Sales Cloud and the other four "new businesses" launched later, their growth speeds began to decline and converge after fiscal year 2022. By fiscal years 2024 to 2025, the revenue growth rates of all five segments converged to around 10% (with a wider fluctuation range for the Data & Analytics segment but a consistent trend of significantly slowing growth). Salesforce's business composition is diversified, but none of its segments currently exhibit high growth to drive the company's overall growth.
2. Acquisitions—The Secret Behind Salesforce's 20-Year Leadership?
One key reason Salesforce stands out in the SaaS industry is its diversification beyond the early focus on CRM Sales Cloud. Over the past 20 years, Salesforce has successfully developed four other business segments with a volume comparable to Sales Cloud. While this diversification was necessary due to Sales Cloud's growth bottlenecks, its successful achievement demonstrates the management's strategic vision and execution capabilities. Notably, Salesforce's diversification combines internal incubation with successful external acquisitions.
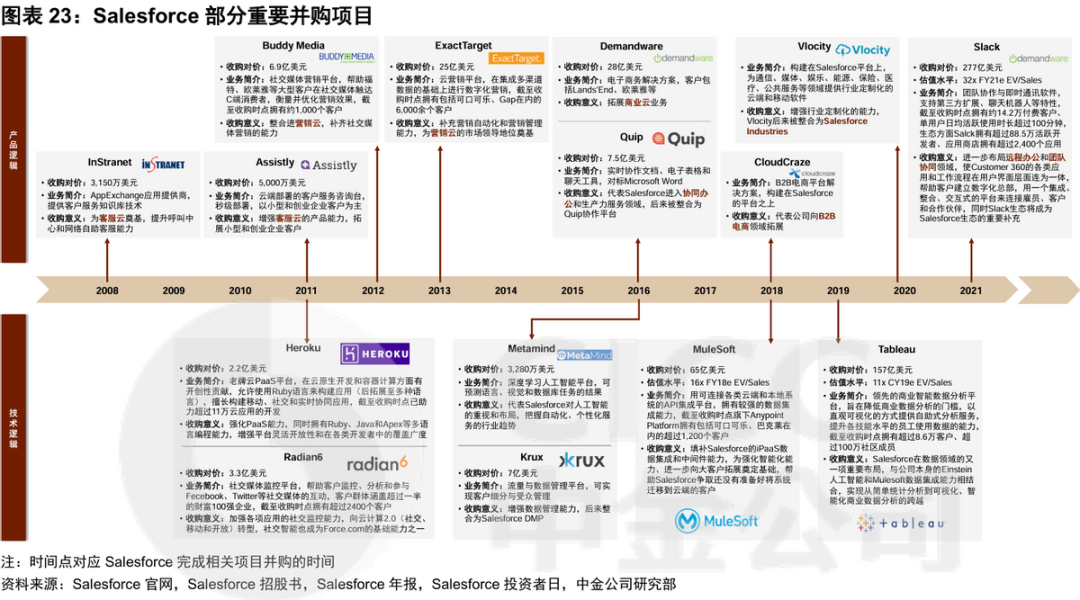
Here's a brief review of Salesforce's important acquisitions and business expansion history:
① 1999~2008: Salesforce, initially a CRM-focused company and an early promoter of "cloud services," targeted small and medium-sized enterprises with limited budgets, achieving rapid growth. To avoid the customization pitfalls of traditional software industries, Salesforce began building a PaaS platform after the new millennium, launching Force.com and AppExchange in 2007. This marked the technical prerequisites for diversified business expansion, paving the way for subsequent mergers and acquisitions.
② 2008~2013: With the PaaS platform in place, Salesforce ventured into customer service cloud and marketing cloud by acquiring InStranet, Buddy Media, ExactTarget, and others. This quickly obtained technology and customer resources, launching Service Cloud in 2009 and Marketing Cloud in 2012.
③ 2016~2018: With the rise of e-commerce, Salesforce strengthened its capabilities by acquiring Demandware and CloudCraze. This aimed to capture e-commerce growth and defend against competitors like Adobe and Shopify.
④ 2018~Present: Salesforce completed the establishment of major functional SaaS businesses under CRM and embarked on larger-scale mergers and acquisitions, including MuleSoft, Tableau, and Slack. These acquisitions expanded Salesforce's business span and volume.
Salesforce's business expansion and acquisitions showcase the management's excellent acquisition "vision," enabling rapid expansion into new businesses without being limited to Sales Cloud or relying solely on internal R&D. For a company, successfully diversifying after its pillar business matures may be key to continued growth over decades. Among Dolphin Investment Research's coverage, Alibaba and Broadcom provide positive and negative examples. While Alibaba has diversified widely, its outcomes are less successful, still primarily relying on its core domestic e-commerce business. In contrast, Broadcom has become the third-largest semiconductor company with a market capitalization exceeding $1 trillion through continuous successful mergers and acquisitions.
3. Not Only Good at Buying, But Also Good at Integrating
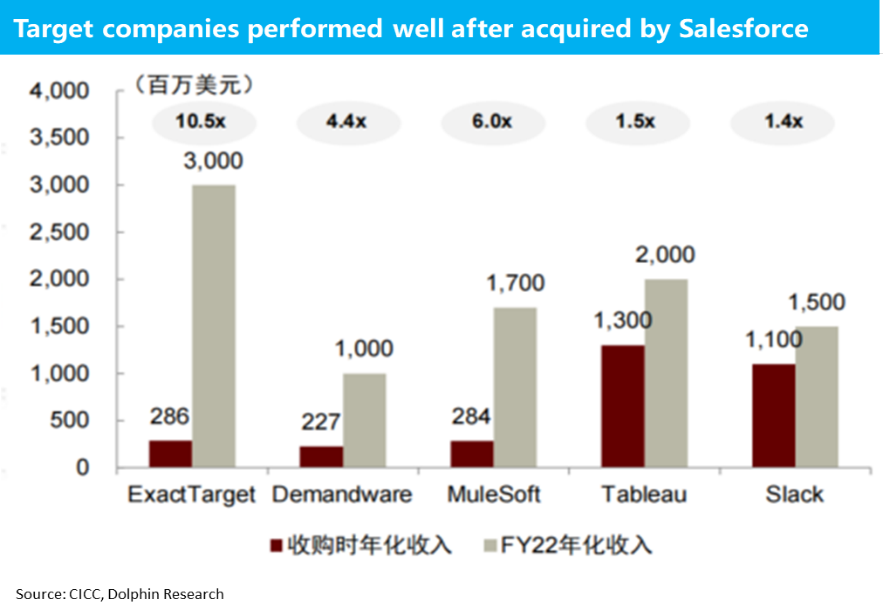
Salesforce not only expands rapidly through acquisitions but also successfully integrates acquired assets and generates synergies. Financially, the revenue of new segments like Customer, Marketing & E-commerce, and Data Analytics is comparable to the original Sales Cloud segment. Market share-wise, Salesforce ranks first in its original Sales SaaS segment with approximately 29% market share and also leads in customer service, marketing & e-commerce, and platform cloud segments launched after mergers and acquisitions. In data analytics, Salesforce holds the third-largest share. All new business segments launched a decade after Salesforce's establishment have achieved top 1-3 positions in the industry.
From an asset perspective, revenues of assets acquired in 2018 and earlier have generally increased severalfold compared to acquisition. Even for Tableau and Slack, acquired in 2019 and 2021, respectively, their fiscal year 2022 revenues are predicted to have increased by 40% to 50%. This indicates significant synergies after integration, with Salesforce leveraging a larger user base, cross-selling, and technological optimizations to boost acquired targets' revenues.
Salesforce excels at integrating and improving acquired assets' efficiency, enabling mutual enhancement between original and new businesses.
II. Under the SaaS Evaluation System, Is Salesforce Good or Bad?
Unlike traditional industries, SaaS companies are generally valued at 10x P/S or higher. Under conventional P/E or cash flow valuation systems, SaaS companies' valuations are significantly higher, indicating a unique evaluation system and key indicators. Under this system, how does Salesforce compare to other SaaS companies? Are there any unique aspects?
1. The Core of the Core—LTV
In the SaaS industry, two universal and important indicators are LTV (Lifetime Value) and CAC (Customer Acquisition Cost). LTV refers to the total revenue generated by a customer throughout their lifecycle, including initial and subsequent purchases, cross-selling, upgrade sales, and referral revenue. CAC refers to the total cost incurred to acquire a new customer, including marketing, sales, and advertising expenses.
To put it bluntly, LTV (Lifetime Value) quantifies the total revenue a SaaS company can generate from a single customer, whereas CAC (Customer Acquisition Cost) signifies the expenditure required to secure one customer. The difference between these two metrics represents the "excess" revenue a SaaS company earns from each customer. Given the high switching costs associated with SaaS tools and the widespread adoption of a predictable subscription-based pricing model, ideally, a customer can consistently contribute revenue over an extended period, while the cost of acquiring them is a one-time expense. The typically high gross margins of SaaS companies (commonly ranging from 70% to 80%) imply that as a SaaS company's customer base matures and customer acquisition costs significantly decrease, the company sustains continuous, nearly perpetual, and highly profitable revenue and cash flow. This consensus explanation underscores why SaaS companies generally command higher valuations in the market.
Among these two metrics, LTV, which focuses on revenue generation, is relatively more critical and offers greater flexibility. It can be further broken down into:
① The average paid lifecycle of a single customer, i.e., the duration for which a company's users continue to pay on average, be it 5 years, 10 years, or 2 years, reflecting the company's ability to retain users.
② The average revenue per user (ARPU), i.e., the average revenue the company generates from a single user per payment cycle. This can be further analyzed by considering the average number of different types and levels of products used by a single user and the average pricing of these products.
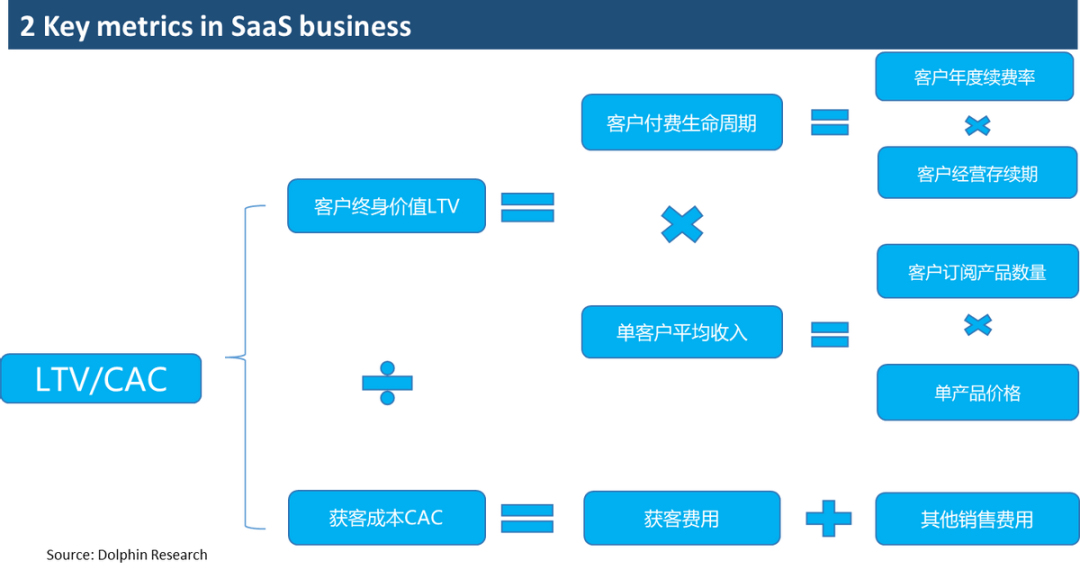
For customer paid lifecycle, common metrics include customer renewal rate or customer churn rate. Using a simple mathematical formula, for a company with an average user renewal rate of 'a', the expected paid lifecycle of its users equals 1 / (1-a). For instance, a company with an annual user renewal rate of 90% has an expected average total paid term of 10 years for its users. As the user renewal rate increases (churn rate decreases), the cumulative total revenue the company can obtain from the same user increases.
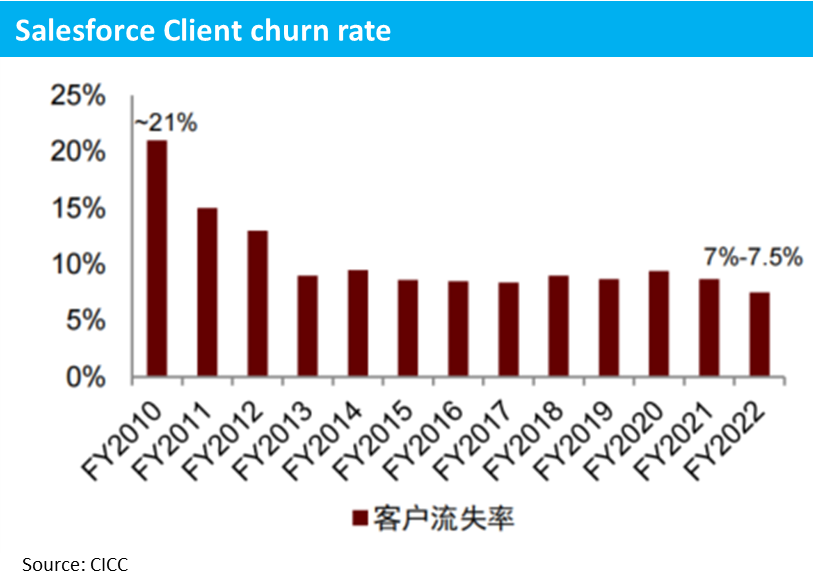
In this context, Salesforce's customer churn rate was as high as 20% in 2010 but has since gradually and steadily declined, stabilizing at below 10% in recent years, around the 7%~8% level. While the reasons for the year-on-year decline in customer churn rate remain to be explored, the result indicates that Salesforce's user stickiness is increasing annually, and the expected paid lifecycle of its users has risen from less than 5 years to about 13 years. In other words, assuming other conditions remain unchanged, this factor alone has increased Salesforce's total lifetime revenue per customer by approximately 2.7x.
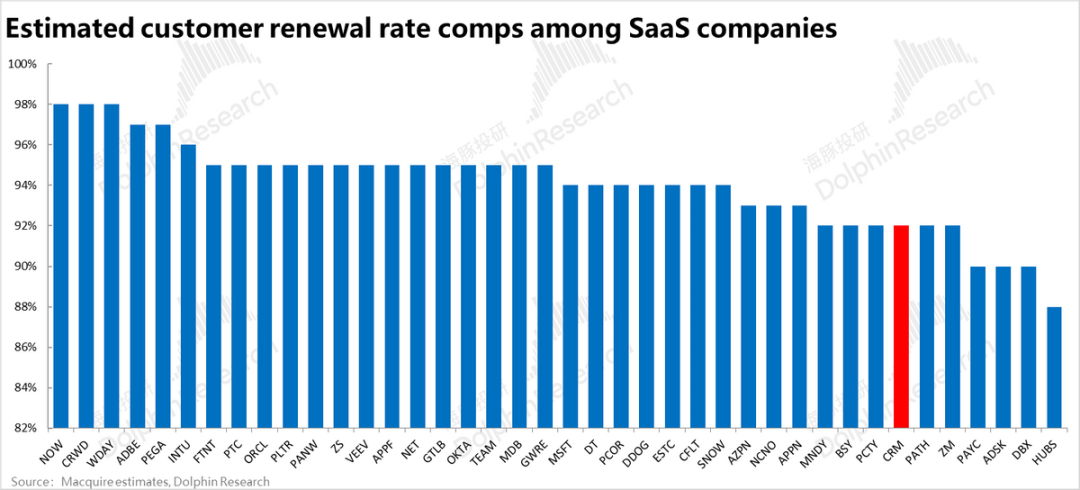
Comparing Salesforce with other SaaS companies, how does its user retention rate fare? As many companies do not officially disclose user retention rates, Dolphin Investment Research uses prediction data from an overseas investment bank as a reference. According to the bank's predictions, Salesforce's slightly above 90% user retention rate is not outstanding when compared horizontally with other SaaS companies and can be considered merely "adequate".
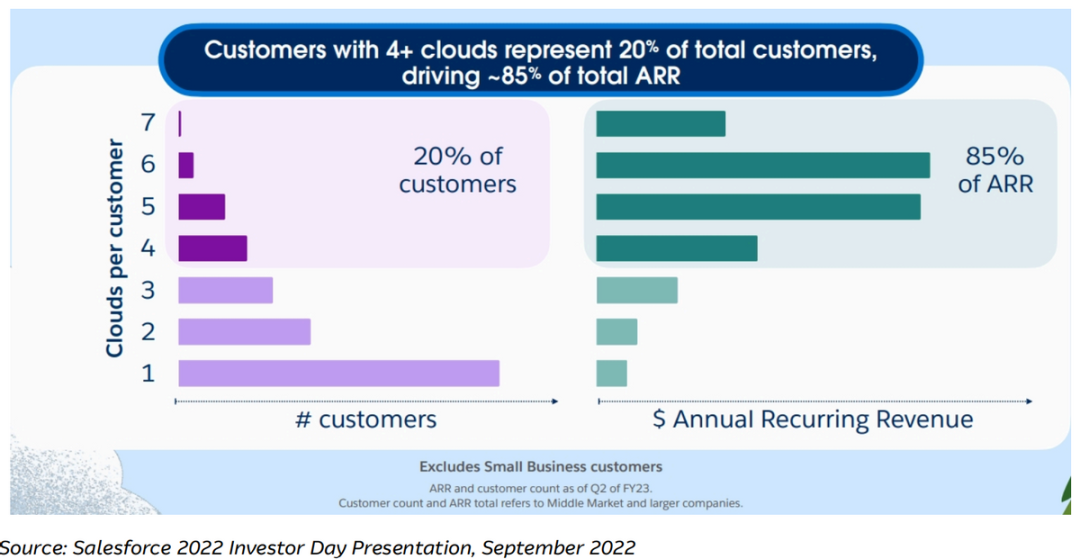
Regarding ARPU, the aforementioned drivers include the number of products used and the average pricing of products. Although the company has not officially announced relevant indicators to visually demonstrate this, according to the company management's disclosure at the FY23 Investor Day: Among all the company's customers, those using four or more cloud products only account for 20% of the total but contribute about 85% of the annual recurring revenue (ARR). This underscores the importance of having a rich and comprehensive product matrix that enables cross-selling and obtaining multiple product subscription revenues from a single user for SaaS companies. This is also why Dolphin Investment Research emphasized in a previous article that Salesforce has gradually enriched its product portfolio through successful acquisitions and product integrations.
Considering that the vast majority of the company's actual revenue originates from a small number of diversified major customers who account for a very low proportion, we believe that Salesforce's user structure gradually leaning towards major customers may also be one of the underlying factors behind the continuously declining customer churn rate and increasing ARPU. As mentioned earlier, Salesforce initially entered the market primarily through small and medium-sized users. In 2003, the proportion of small and medium-sized enterprises to large enterprise users was 7:3, which reversed to nearly 70% of large enterprise users by 2019.
Logically, the long-term survival of small and medium-sized enterprises is uncertain, and the probability of them continuously renewing the same SaaS product is relatively lower. In contrast, large enterprises not only have a longer lifespan but also have significantly higher costs and decision-making processes for switching enterprise SaaS services. Therefore, as the number of large enterprises in the user structure increases, it logically contributes to a decrease in customer churn rate.
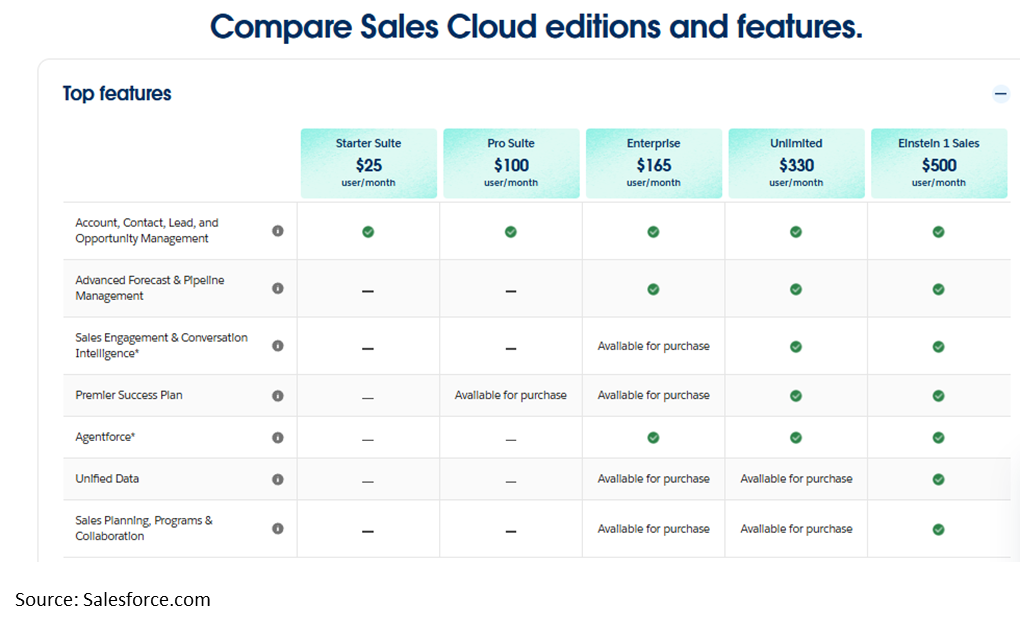
Similarly, current SaaS services generally offer multiple contract types with different pricing tiers. Taking Sales Cloud as an example, it can be seen that only large enterprises typically adopt the highest pricing tier, which is equivalent to 20x the entry-level product and exceeds the pricing of entry-level enterprise products by more than 3x. Therefore, logically, an increase in the proportion of large enterprise users will push up the average product subscription price and increase ARPU. After all, it stands to reason that large enterprise users are more likely to subscribe to more but more expensive products.

2. CAC - The Trade-off Between Growth and Profit
From a cost perspective, customer acquisition cost (CAC), although there is insufficient disclosure to break down the marketing cost of acquiring new customers, the overall marketing expenditure still reveals:
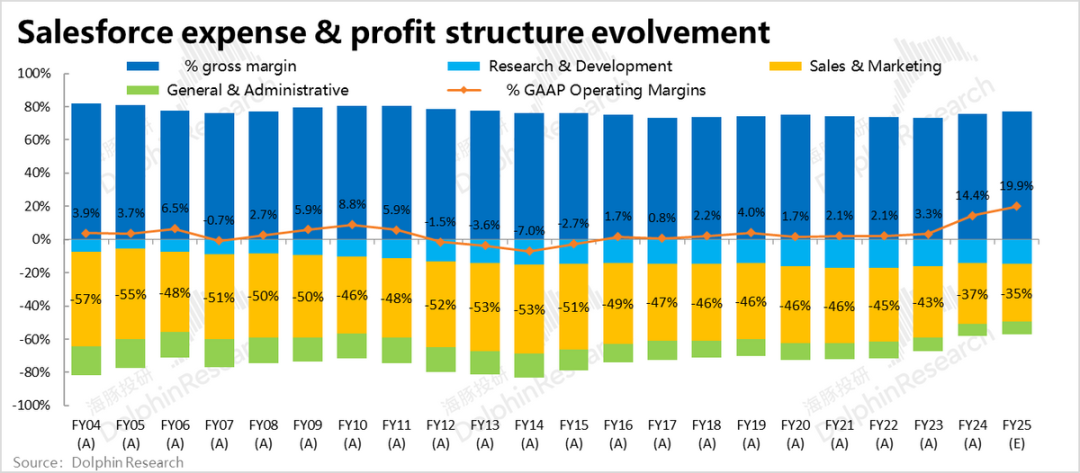
① From the company's inception in the 2000s until FY23, spanning over 20 years, Salesforce's revenue volume has increased by over 300x, but it has not demonstrated significant "scale efficiency" in marketing investment. During the same period, the proportion of marketing expenses to total revenue only dropped from 57% to 43%. Against the backdrop of a time span of over 20 years and a 300x increase in revenue, the mere drop in marketing expense ratio from above 50% to 40% cannot be considered a significant decrease.
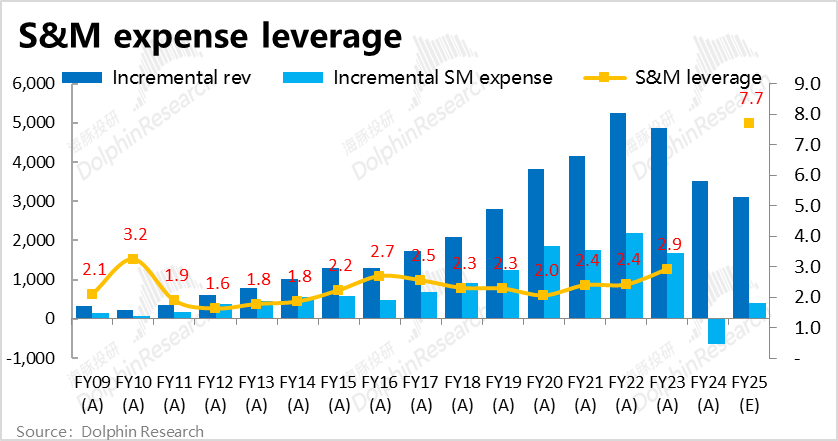
From a marginal increment perspective, the ratio of annual incremental revenue to annual incremental sales expenses has fluctuated only within the range of 1.6x~3.2x in FY23 and before. This perspective suggests no trend towards a higher ROI for marginally increased marketing expenses.
One can even draw the conclusion that until FY23, even for Salesforce, a SaaS enterprise that has been established for decades and can be considered quite mature, the ideal scenario of a significant decrease in marketing expenses while user contribution revenue continues to grow nearly perpetually, thereby significantly improving the company's profit margin, has not materialized.
It's worth noting that Salesforce amortizes and depreciates some of its marketing expenses to align with the narrative logic that its revenue contribution per customer is gradually released over the entire lifecycle, thereby smoothing out fluctuations in the expense ratio to a certain extent. However, even so, the conclusion that sales expenses did not decrease significantly before FY23 remains unchanged.
Of course, from another perspective, Salesforce spent nearly $30 billion to acquire Slack in 2021, and its merger and acquisition expansion are still ongoing. Moreover, before FY23, the company's revenue growth rate was still above 20%, indicating that it was still in a high-growth phase. During this high-growth phase, maintaining a significant marketing investment to prioritize growth is not a point that needs criticism.
It's evident that as revenue growth rates rapidly declined to around 10% in FY24 and FY25, Salesforce's marketing expense ratio dropped significantly to above 35%, and the operating profit margin quickly climbed to above 15%, having maintained single-digit levels for over 20 years. To a certain extent, this validates that when the company no longer focuses on pursuing growth in user volume and revenue scale, it does have the ability and space to improve the company's profit by reducing marketing investment.
From the source of incremental revenue, only 18% of incremental revenue in FY22 came from new users. As growth continues to slow down significantly in recent years, it's presumed that the contribution from new users should continue to decline. After no longer relying on new users to contribute incremental revenue, it's natural for companies to have reduced needs for customer acquisition expense investment.

III. When is the Right Time to Invest in Salesforce?
Our discussion above can be summarized into two points: ① Reviewing Salesforce's development history, we believe the company's management team possesses excellent abilities to continuously discover promising growth directions within the rapidly evolving SaaS industry and enrich the company's product matrix over a span of more than 20 years through effective mergers and acquisitions. The company has consistently maintained a growth rate of over 20%. Therefore, from a qualitative perspective, we believe that in the future, Salesforce has a good chance of continuing to maintain a relatively leading position in the industry amidst the evolution of AI. (As the first company in the industry to launch the AI Agent concept product, this also seems to validate this point).
② However, it cannot be ignored that aside from the potential increment of Agentforce, Salesforce seems to have indeed reached a growth bottleneck. But judging from the trend of the past two years, when there is indeed no more room for growth, Salesforce's still high marketing expense ratio of above 35% does have considerable room for decrease, in exchange for an increase in profit margin. In other words, the company has the ability to make a trade-off between growth and profit margin.
The last question this article attempts to answer is, with the existing business seemingly losing growth momentum, and while Agentforce has grand prospects (and drives market preference for the company), there is still considerable time and uncertainty before it actually contributes to performance. Is the current Salesforce a good opportunity? Or when will a good opportunity arrive?
Based on the current situation, Dolphin Investment Research adopts a valuation approach that first ignores the highly uncertain Agentforce and only considers the reasonable valuation of the original business. Therefore, none of the following valuations and earnings forecasts consider the impact of Agentforce (neither potential incremental revenue nor incremental marketing expenses or their impact on profit margin).
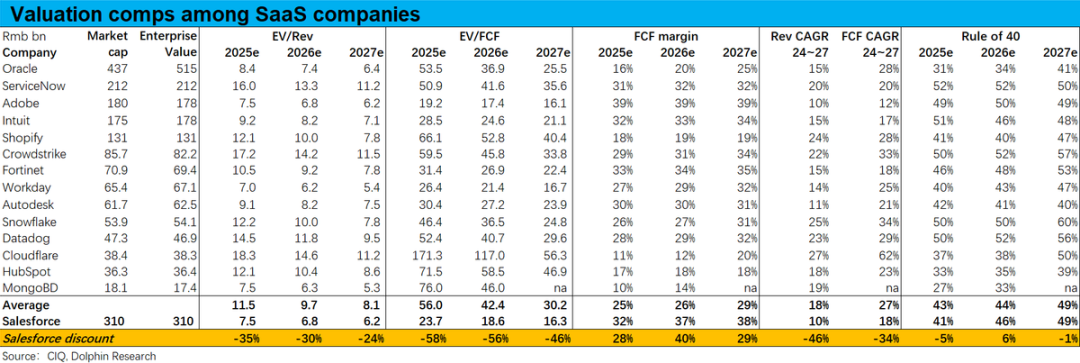
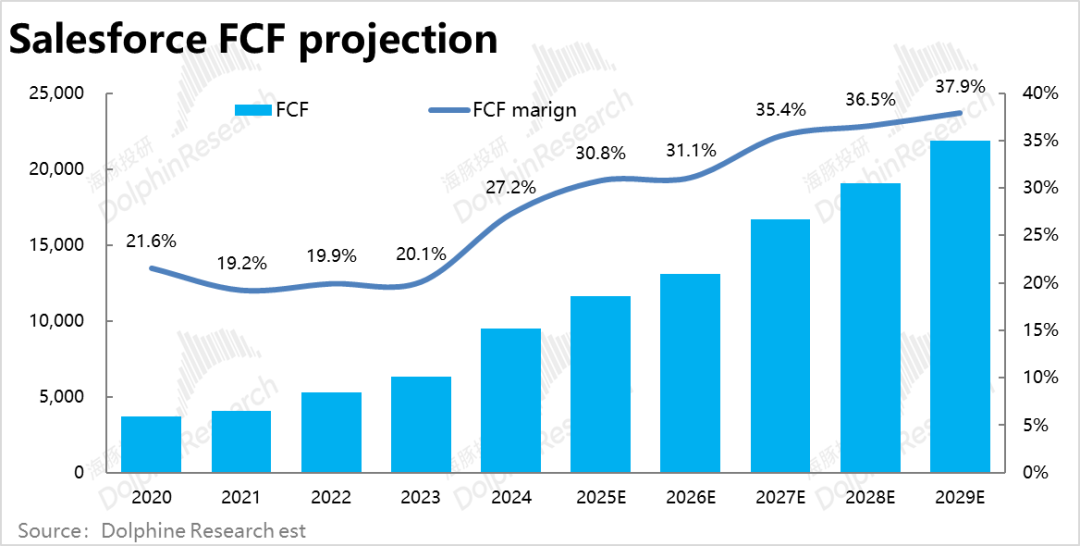
First, from a comparative valuation perspective, it can be seen that Salesforce's valuation, whether from the EV/S or EV/FCF angle, is about 30%~50% lower than the industry average. An interesting point is that the current market valuation of SaaS companies places much more emphasis on growth potential than profitability. It can be observed that Salesforce's FCF margin is actually significantly higher than the industry average, and the Rule of 40 (a commonly used indicator for SaaS companies, referring to the simultaneous consideration of revenue growth rate + FCF margin, which measures both growth and profitability) indicator for Salesforce is only slightly lower than the industry average.
However, in terms of revenue CAGR and FCF CAGR, Salesforce is lower than the industry average expected by market consensus by over 40% and 30%, respectively, which is roughly similar to the discount amplitude of its valuation. From this perspective, if Salesforce's growth performance improves subsequently, the space for its valuation to revert to the mean is considerable.
Under the absolute valuation method, as Salesforce already has a considerable and stable cash flow, it may be one of the few SaaS companies that can be valued using DCF. Based on the following FCF cash flow forecast, we estimate that the neutral valuation of Salesforce's original business (not considering Agentforce) is approximately **, which is about ** lower than the current share price. (The valuation involved is hidden content. Please enter the Longbridge App's "Dynamics - Investment Research" section to view the article with the same name.) In other words, we can understand that if a relatively full valuation is given to Salesforce's original business, the current price has already factored in about ** of incremental revenue or valuation brought by Agentforce, which is not very high. According to our previous calculations, when Agentforce's penetration rate reaches 5% and 10%, it can bring approximately 10% and 20% of incremental revenue, respectively.
To put it another way, if you foresee the penetration rate of Agentforce surpassing 5% to 10% in the future, then there remains ample room for the current price to appreciate. The magnitude of this potential growth hinges on how effectively Agentforce can be integrated into practical applications.
-
![]()
Dianping Merges into Core Local Business as Meituan Advances Towards Greater Unity
-
![]()
Reevaluating vivo's Leap into Robotics
-
![]()
iOS 18.5 In-depth Review: Does Apple's Latest Update Cater to Chinese Users?
-
![]()
Qingming Holiday Spurs Demand Surge! Will Hitchhiking Become the Next 100 Billion Travel Market?
-
![]()
Samsung S25 Claims the Title of the Price Drop King in 2025, Outpacing iPhone 16e
-
![]()
Unisound AI Races to Hong Kong IPO with Estimated Valuation of RMB 9 Billion
-
![]()
QuantGroup Garners Broad Market Acclaim, Recently Pursuing IPO
-
![]()
California Startup Unveils Groundbreaking Optical Interconnect Technology to Revolutionize AI Computing


